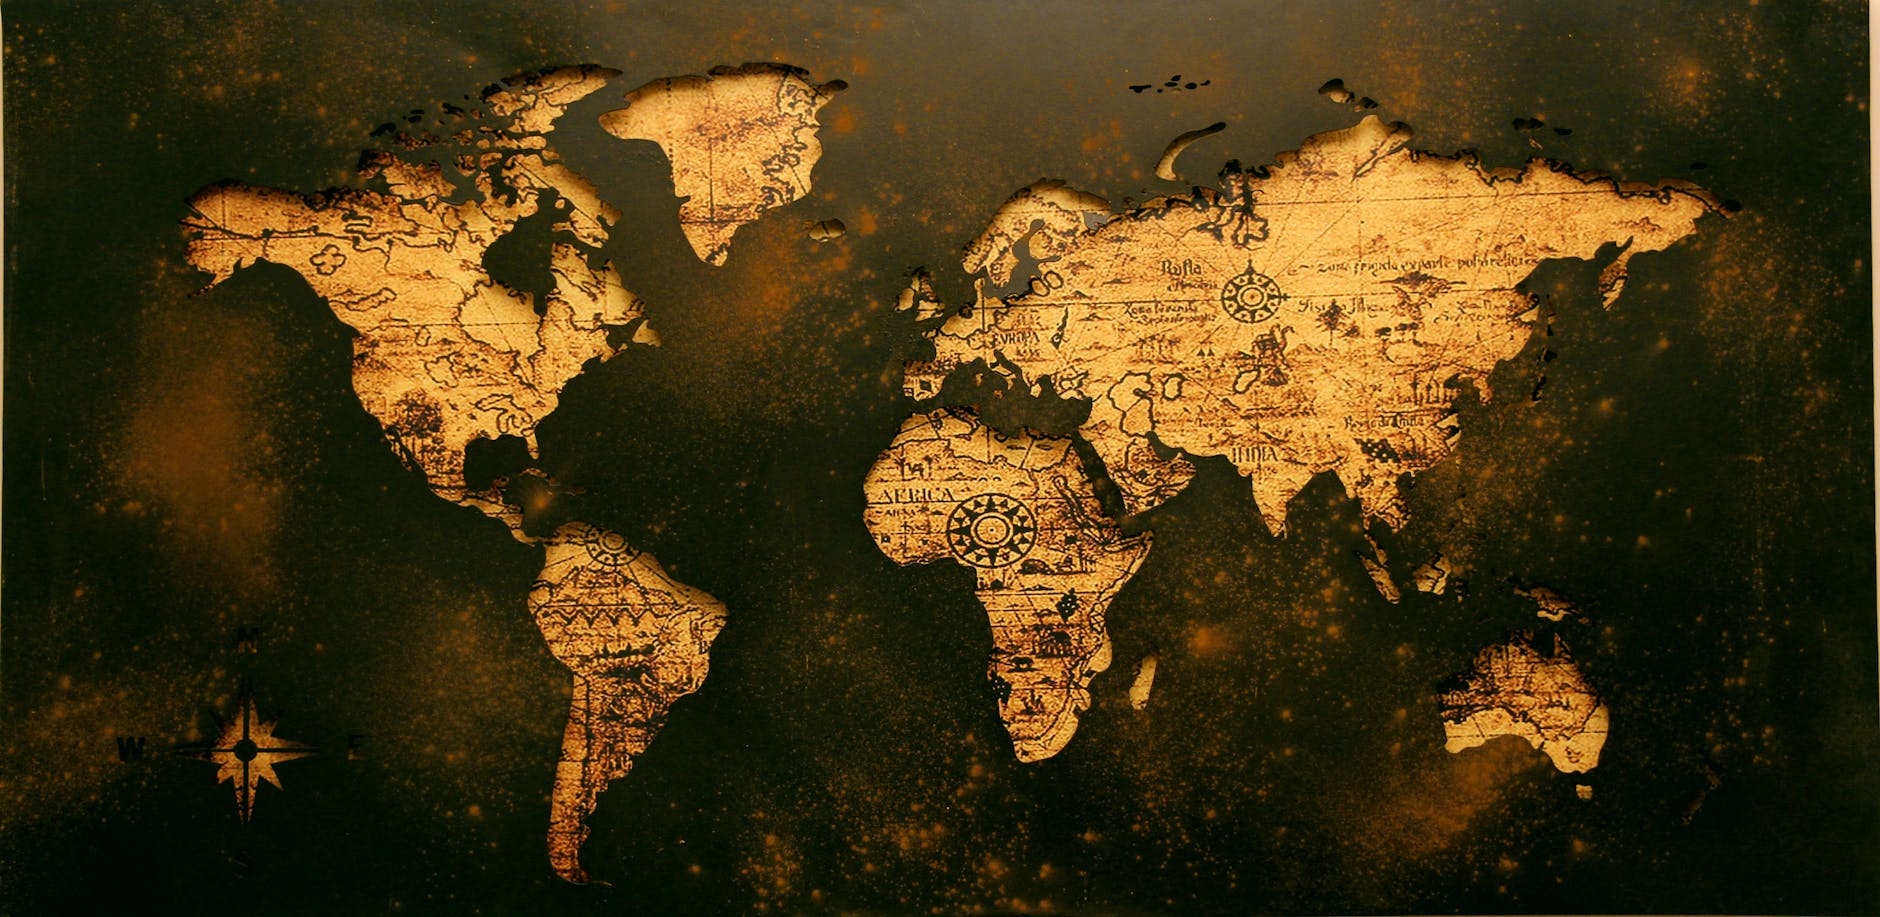
Humans have been making maps for thousands of years.
Long before satellites, GPS, or QGIS, our ancestors carved geographic knowledge into clay, parchment, and stone — because understanding space has always been a matter of survival.
The history of cartography is not just a story about maps.
It is a story about how human civilization has observed, recorded, and communicated the world around it.
And if you work in GIS, remote sensing, or any geospatial field today, that story is your professional heritage.
Let’s dive in.
Contents
What Is Cartography, Really?
Before tracing the history of mapping, it helps to understand what the word “cartography” actually means — and why that definition keeps changing.
Before 1960, cartography was defined simply as the making of maps. That definition was functional, but narrow. It said nothing about who used maps, or why, or how information moved from maker to reader.
Two major forces changed that: the recognition of cartography as a science of communication, and the arrival of the computer. Together, they pushed the field to expand its definition.
Cartography became “the conveyance of geospatial information in the form of a map.”
Suddenly, the discipline cared not just about production but about how people interacted with maps as tools for understanding the world.
The definition of a map also had to catch up.
A map came to mean “a conventional representation, mostly made on a flat surface, depicting real or abstract phenomena in a defined space.” Globes and relief models count too — not just paper sheets.
Then came GIS.
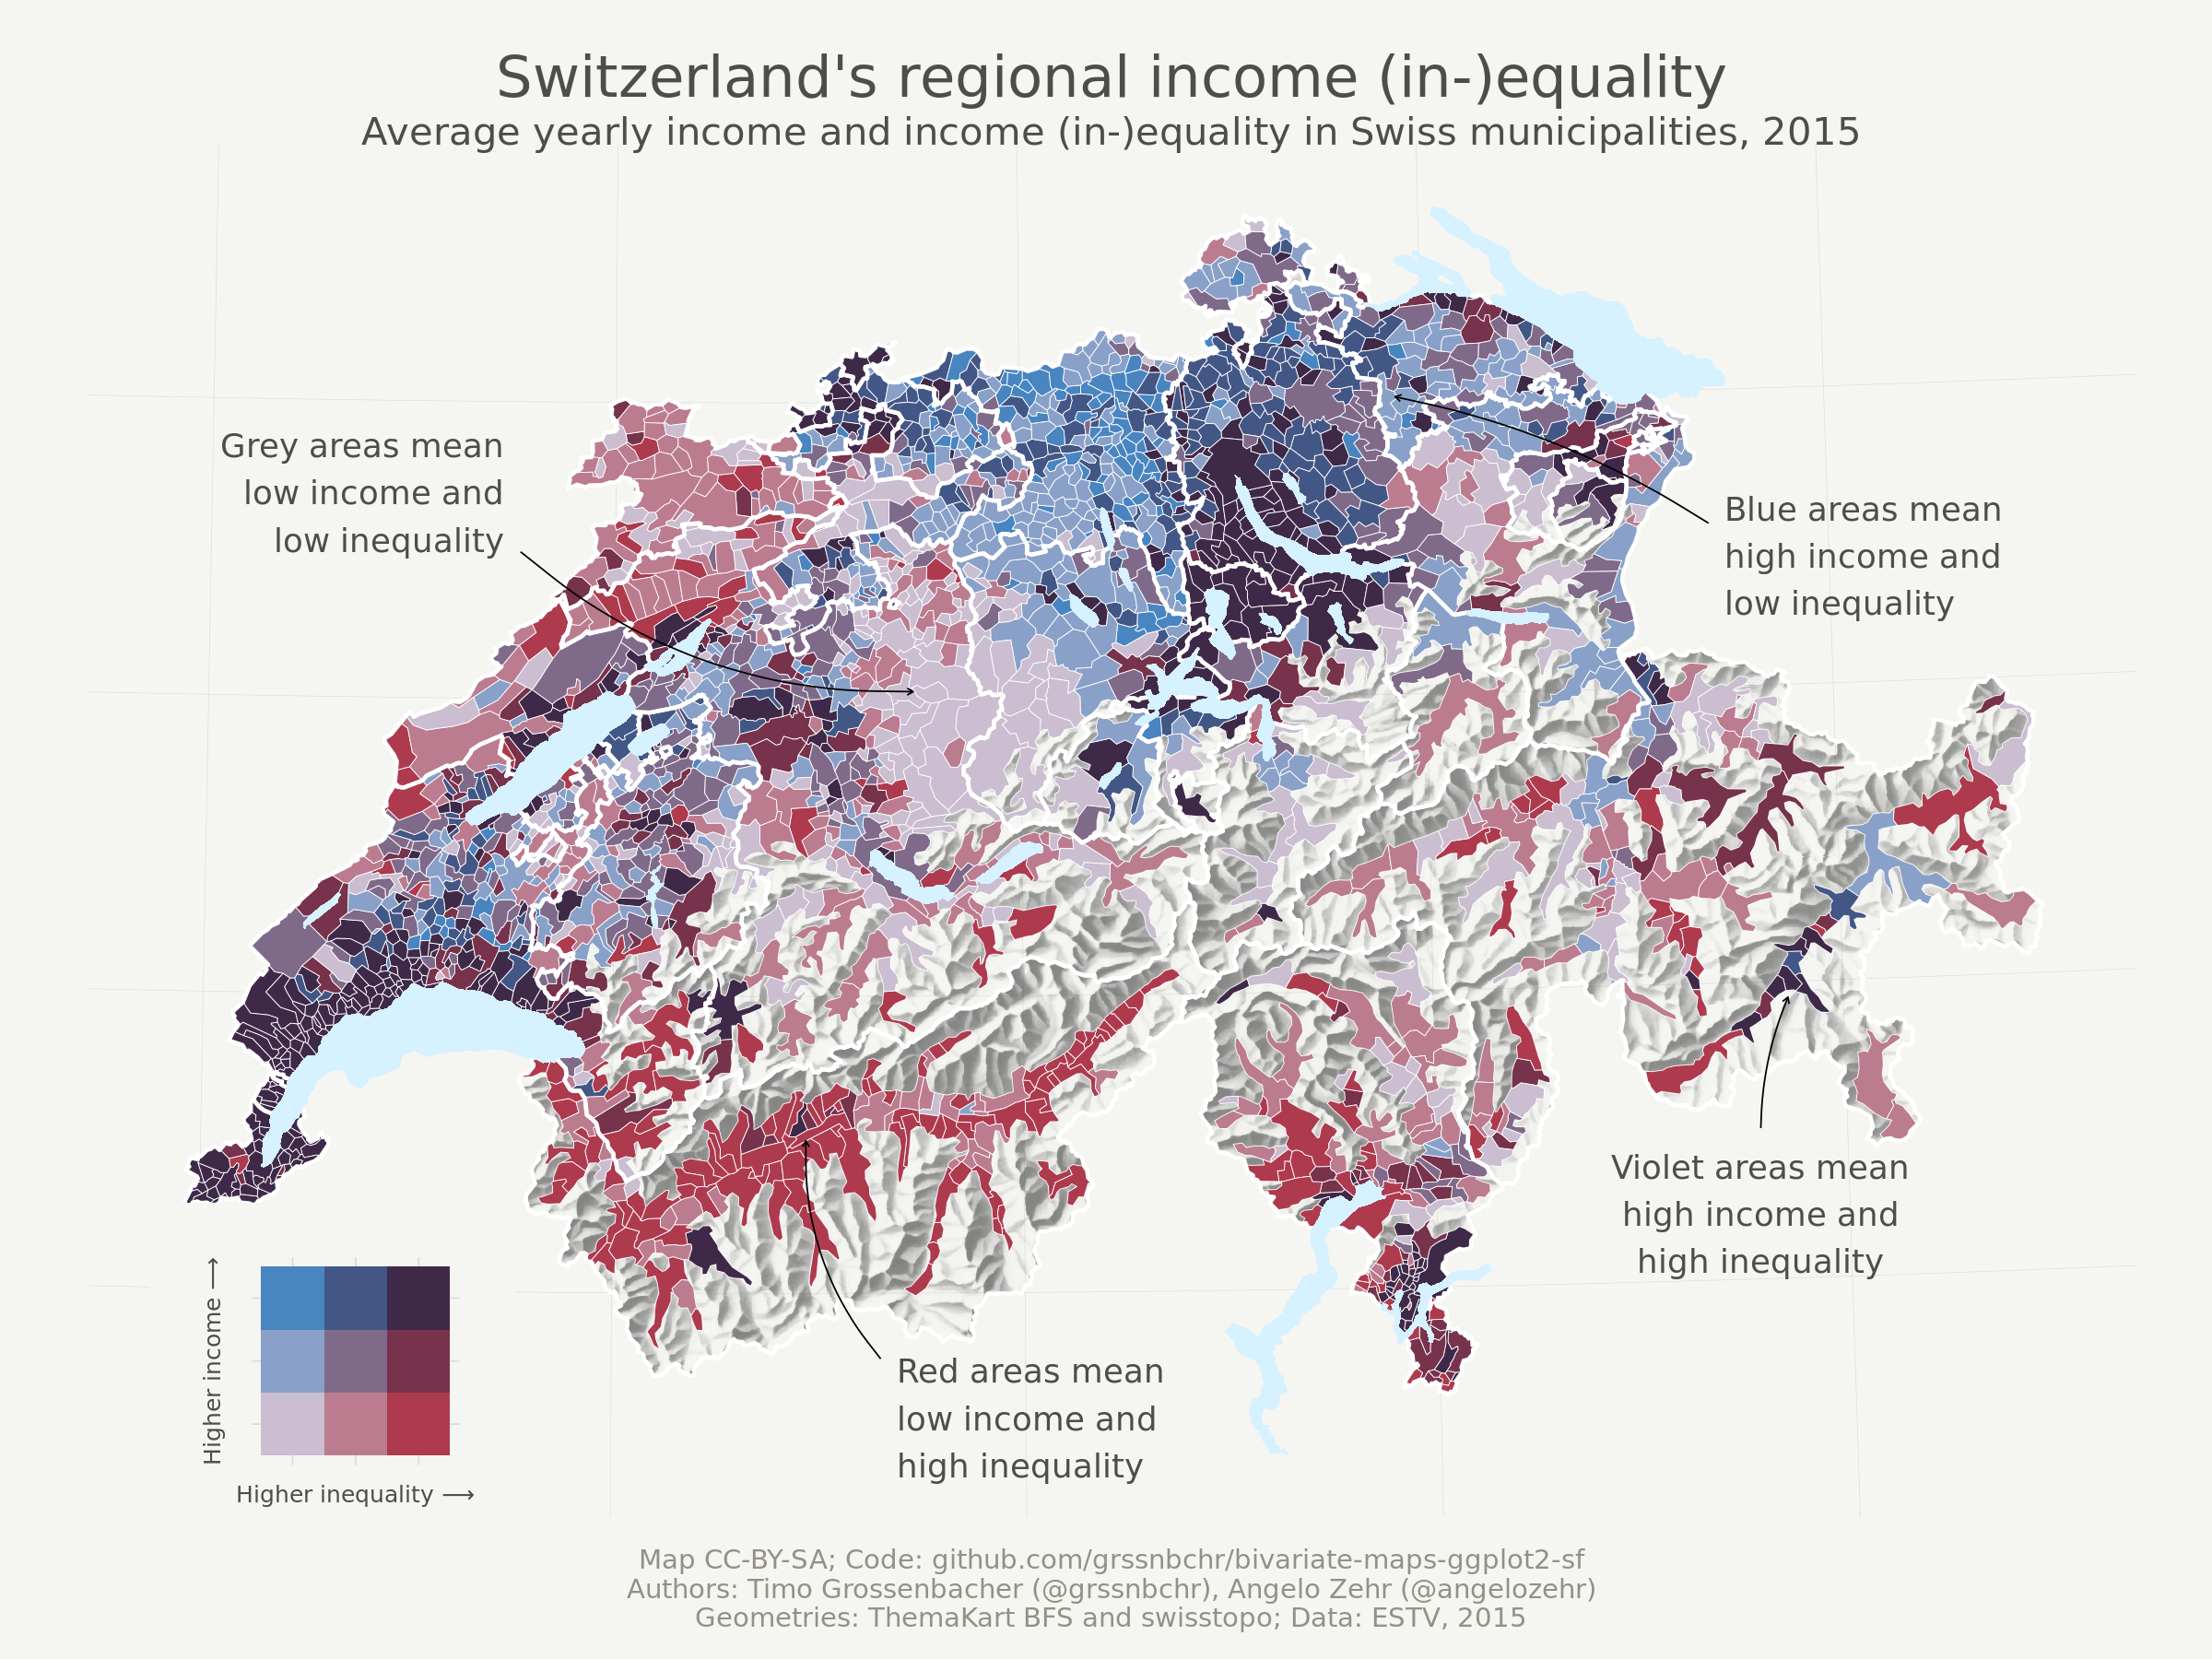
Kraak and Ormeling pushed the definition further still: cartography now involves making spatial data accessible, emphasizing visualization, enabling interaction, and connecting all of it to real geospatial problems.
Based on my experience working with geospatial concepts, this definitional evolution is not just academic trivia. It reflects a genuine shift in what cartographers actually do and what you, as a modern GIS professional, are expected to do when you share a map with a client or colleague.
The Four Periods of Cartographic History
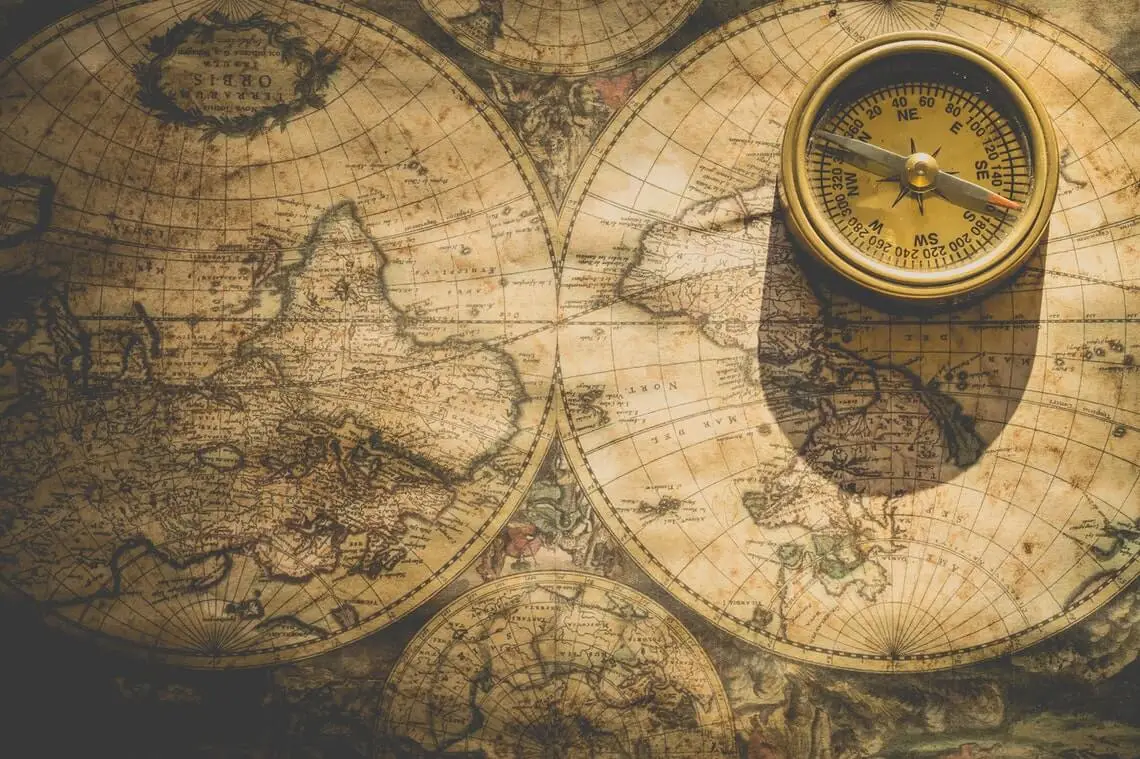
Cartographic history spans thousands of years and four distinct periods, each shaped by the tools, knowledge, and worldview of its time. Understanding these periods gives you a clearer picture of why modern mapmaking works the way it does.
The Early Period: Clay, Parchment, and the Spherical Earth
The history of map-making begins with the Babylonians. Around 2300 BCE, they carved the world as they knew it onto clay tablets — some of the oldest surviving geographic representations ever found.
The ancient Greeks took mapmaking in a dramatically different direction. They introduced something revolutionary: the idea that the Earth was spherical.
Eratosthenes, a Greek scholar, attempted to measure the Earth’s circumference using the distance between the cities of Syene and Alexandria and the angle both cities formed relative to the Earth’s center. His result — roughly 46,250 km — was only about 15% off from the actual figure.
That is an extraordinary achievement for someone working without satellites or computers.
His work was not perfectly accurate, of course. The Earth is not a perfect sphere but an oblate spheroid. Even so, the theoretical model he established — called the authalic sphere, with a radius of 6,376 km and a circumference of 40,030 km — remains foundational in map projection work today.
The defining artifact of this period is the world map produced by Ptolemy. His Geographia brought together geographic coordinates, projection theory, and systematic cartographic methodology. Think of it as the first attempt to build a consistent framework for representing the entire known world.

The Medieval Period: Faith at the Center of the Map
During the medieval period, European cartography took a step away from scientific measurement and toward symbolic representation.
Maps from this era placed religious centers — most famously Jerusalem — at the center of the world.
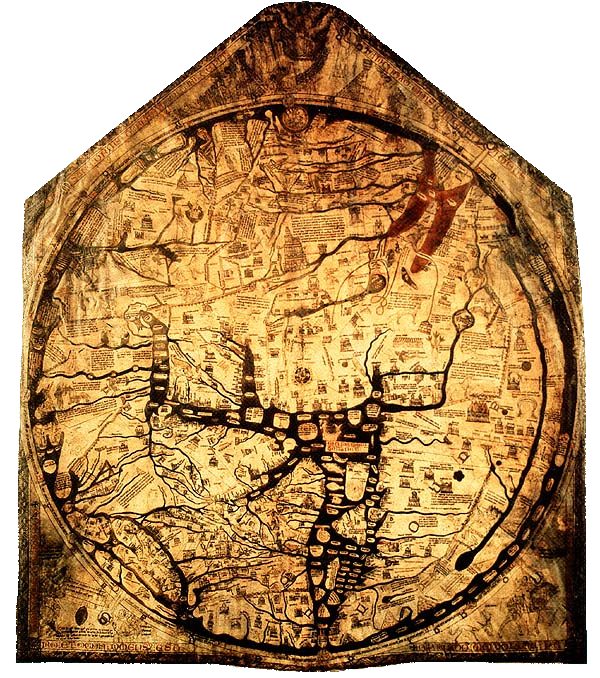
The T-O map became the dominant format: a circle divided by a T-shaped body of water, with Asia at the top, Europe at the lower left, and Africa at the lower right.
These were not navigation tools. They were cosmological statements — representations of a theological worldview more than a geographic one.
Maps were still drawn by hand, their distribution was limited, and they reflected the cultural priorities of the institutions that commissioned them. The medieval map tells you less about where things are and more about what its makers believed mattered.
From a cartographic standpoint, this period is a reminder that maps are never neutral. Every map embeds the assumptions, priorities, and worldview of its maker. That remains just as true in modern GIS as it was in 1300.
The Golden Age: Printing Presses, Exploration, and Mercator
The Golden Age of cartography — roughly the 15th and 16th centuries — transformed mapmaking from a slow, hand-crafted process into a reproducible, distributable discipline.
The invention of the printing press made it possible to produce maps at scale. Woodblock printing and copper engraving became the standard methods. For the first time, the same map could reach multiple readers in multiple places.
This era coincided with the Age of Exploration. Voyages by Columbus, Vasco da Gama, and others rapidly expanded the known world. Cartographers scrambled to incorporate new geographies into their frameworks — and some of them got it famously right.
In 1507, Martin Waldseemüller produced a world map that used Ptolemaic projection but extended it to include the newly discovered landmasses of the western hemisphere. It was the first map to apply the name “America.”
Then came Mercator.
Gerard Mercator’s cylindrical projection, developed for navigation in 1569, solved a specific and practical problem: how to draw straight lines on a flat map that correspond to consistent compass bearings at sea. It worked brilliantly for navigation — and it has been used, debated, and critiqued ever since.
From my perspective, understanding Mercator’s original intent matters enormously.
The projection was never designed to represent the relative sizes of continents accurately. It was built for sailors. Many of the contemporary criticisms of Mercator projection stem from using a navigation tool as a general-purpose world map — a purpose it was never designed to serve.

The Modern Period: From Aerial Photography to Digital GIS
The modern period of cartography is defined by precision and computation.
Aerial photography arrived in the early 20th century and gave cartographers something they had never had before: a true bird’s-eye view of the Earth’s surface. Remote sensing — capturing data from aircraft and later satellites — made it possible to map areas that were previously inaccessible, dangerous, or simply too vast to survey on foot.
Then came the computer.
The shift to digital cartography changed everything about how maps are made — from data collection and analysis to symbolization and output. Processes that once took weeks of manual drafting could be completed in hours. Reproduction quality improved. Updates became faster and cheaper.
Crucially, the computer gave rise to Geographic Information Systems.
GIS separated the geographic data from its visual representation, allowing analysts to store, query, and manipulate spatial information independently of any single map output. Through GIS, a single dataset could generate dozens of different maps for dozens of different purposes.
The internet extended cartography’s reach even further. Web cartography platforms made it possible to publish maps to global audiences instantly. Tools like Marine Traffic turned complex, real-time geospatial data into interactive public interfaces.
As I’ve observed in the geospatial community, the line between “making a map” and “doing spatial analysis” has blurred almost completely in the modern period.
Today’s cartographer is often also a data analyst, a programmer, and a communicator — all at once.

Where Is Cartography Now?
The state of cartography today reflects decades of accelerating technological change.
GIS Software and Democratized Mapmaking
Software like QGIS and SAGA GIS has democratized mapmaking. Anyone with a laptop and an internet connection can learn to build professional-grade maps without paying for expensive proprietary licenses. Applications like Google My Maps push this even further — enabling map creation without any GIS training at all.
GPS and Field Data Collection
GPS and GNSS technology has transformed data collection. What once required weeks of field surveying can now happen in hours, with positional accuracy measured in centimeters. The same technology that guides aircraft now runs quietly in the smartphone in your pocket.
Crowdsourced and Citizen Science Mapping
The rise of citizen science and crowdsourced mapping has opened a new frontier. Platforms built around contributor networks allow ordinary people to collect and submit geographic data — feeding into databases that professional cartographers and analysts draw on every day.
Thematic Maps and the Familiar Map User
Thematic maps have also changed in character. As general audiences have grown more familiar with maps through social media and data journalism, cartographers have shifted toward designs that emphasize thematic clarity over geometric precision. A map shared in a news article or on Instagram prioritizes communication speed over survey accuracy — and that is a legitimate design choice, not a flaw.
Big Data and Spatial Data Science
Big data has introduced spatial data science as a distinct discipline. Maps are increasingly the output of large-scale data processing pipelines, built in R or Python rather than assembled in a GIS interface. The analytical work happens upstream; the map is the final visualization of a computational process.

What Does the Future of Cartography Look Like?
The trajectory is clear: faster, more automated, and more accessible.
Automation and Map Generalization
Map production will continue to accelerate.
Automated map generalization — the process of simplifying map content for different scales — is already moving toward machine learning solutions.
Classification and symbolization, tasks that cartographers once performed manually through careful judgment, are increasingly handled by algorithms.
AI and the Shifting Role of the GIS Professional
Artificial intelligence will take on more of the analytical work that currently requires specialized GIS skills.
This does not mean GIS professionals become redundant. It means the work shifts: from performing routine spatial operations to interpreting results, designing communication strategies, and ensuring that automated outputs are scientifically sound and ethically considered.
Big Data and the Living Map
Big data will continue to reshape what maps are for.
As datasets grow larger and more complex, the map becomes less a product of deliberate design and more a window into a living stream of spatial information.
From what I’ve seen in the field, the professionals who will thrive are those who understand both the technical and communicative dimensions of cartography — people who know not just how to build a map, but why spatial representation choices matter and what they communicate to an audience.
How Were Maps Made Before Cartography Existed?
This is a harder question to answer than it first appears.
Maps are, by definition, a product of cartography.
So in a sense, wherever maps were being made, cartography was already happening — even if it had not yet been organized into a formal discipline or named as such. Early mapmaking likely existed as a loose collection of skills and accumulated knowledge, passed down through practice rather than systematically documented as a science.
The Imago Mundi is a useful example.
Dating to around 600 BCE, it is one of the oldest known maps in the world. It was made on a clay tablet and depicted a very limited area — the region of Babylonia. Geographic features were drawn in broad, general strokes with little detail, and scale as we understand it today was not represented accurately.
What the Imago Mundi shows is that the human impulse to represent space spatially predates any formal cartographic framework.
People were solving the same core problem — how do I record and communicate where things are — long before anyone had a systematic method for doing it.

FAQ
When did cartography begin?
The earliest known maps date to around 2300 BCE, made by the Babylonians on clay tablets. The Greeks significantly advanced the discipline from around 600 BCE onward, introducing concepts like a spherical Earth and systematic coordinate systems.
What is the difference between cartography and GIS?
Cartography is the science and art of making maps — it concerns how geographic information is represented visually and communicated to an audience. GIS (Geographic Information Systems) is a technology platform for storing, analyzing, and managing spatial data. In practice, GIS is a major tool of modern cartography, but the two are not the same thing. You can use GIS without producing a meaningful map, and excellent cartography requires more than just knowing your software.
Who made the first accurate world map?
That depends on your definition of “accurate.” Ptolemy’s world map from the 2nd century CE was groundbreaking for its use of coordinates and projection. Waldseemüller’s 1507 map was the first to include the Americas. Mercator’s 1569 projection was the first optimized for navigation. Accuracy has always been relative to the purpose of the map.
How has digital technology changed cartography?
Digital technology has transformed nearly every stage of the cartographic process. Data collection is faster and more precise thanks to GPS and remote sensing. Analysis is handled through GIS software. Symbolization and layout happen in digital design environments. Distribution happens instantly via the web. The result is that maps are cheaper to produce, easier to update, and accessible to far more people than ever before.
Is cartography still a relevant skill today?
More than ever. As automated tools make it easier to generate map outputs, the ability to critically evaluate those outputs — to understand projection choices, symbolization decisions, scale effects, and communication intent — becomes more valuable, not less. Anyone can generate a map today. Understanding whether that map communicates something true, accurate, and useful is a cartographic skill.
What is cybercartography?
Cybercartography is an emerging subfield that expands cartography beyond static or even interactive maps into multisensory, networked, and collaborative geographic representations. It reflects the full convergence of cartography with digital communication, multimedia, and participatory data environments.
Wrapping Up
The history of cartography is a story of human ambition to understand and communicate space — from a Babylonian clay tablet to a real-time satellite feed processed through Python. Every tool, every definition shift, and every methodological breakthrough reflects a civilization trying to answer the same fundamental question: where are we, and how do we show that to each other?
For geospatial professionals today, that history is not just background knowledge. It is context for every projection decision, every symbolization choice, and every dataset you work with. The tools have changed dramatically. The core challenge has not.
If you found this overview useful, I’d love to hear what part of cartographic history surprises you most — or which era you think had the greatest impact on modern GIS. Drop your thoughts in the comments below.
Happy mapping!