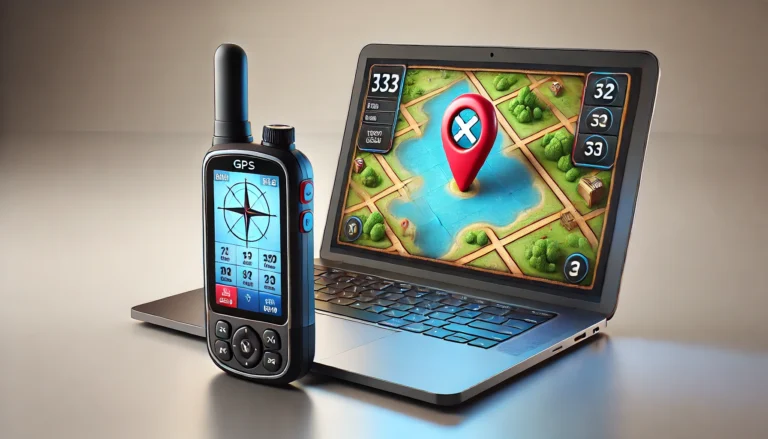
Did you know that maps have been shaping how people view the world for thousands of years, from ancient civilizations to modern-day navigation apps?
But what is a map, actually?
The way a map is designed can completely transform how you understand not just your surroundings but entire regions of the Earth.
A map is a graphical depiction of a specific area, illustrating features such as landforms, boundaries, and routes. It simplifies complex spatial information using symbols and scales, making it easier to understand geography. Maps are widely used for navigation, planning, and analyzing spatial data across various fields.
Maps do more than just guide you from point A to point B—they visually represent information about the world, making it easier to understand distances, locations, and spatial relationships.
In this article, you’ll discover what a map truly is, why it matters, and how learning to read different map types can sharpen your navigation skills and expand your spatial awareness.
Contents
What is a Map?
The term “map” originates from the Greek word mappa, meaning cloth or table cover.
According to the International Cartography Association (ICA), a map is defined as:
“A conventional and selective depiction that is scaled down, typically made on a flat surface. It can include representations of the Earth’s surface or celestial bodies, showing their locations or data related to Earth’s surface or celestial objects.”
In simpler terms, a map is a scaled-down representation of the Earth’s surface on a flat plane.
While there are various definitions from other experts, they generally agree that every map shows selected objects or phenomena, scaled down, and depicted on a flat surface.
The process of map-making involves several key aspects:
- Selected objects/phenomena – This relates to map generalization.
- Scaled-down – This pertains to the map scale.
- Depicted – This involves map symbols and symbolization.
- On a flat surface – This is connected to map projection processes.
In common understanding, maps are often viewed as general reference tools that depict the Earth’s surface for various purposes. However, there are also specialized maps known as thematic maps, which focus on particular themes.
Historically, maps were manually drawn by hand using conventional tools.
However, as technology has evolved, maps are now presented in various forms, such as in dashboards, smartphone applications, or newspapers.
Modern maps may not contain all the elements found in conventional maps, but they emphasize geospatial information that is tailored to the specific medium and the characteristics of the map reader.
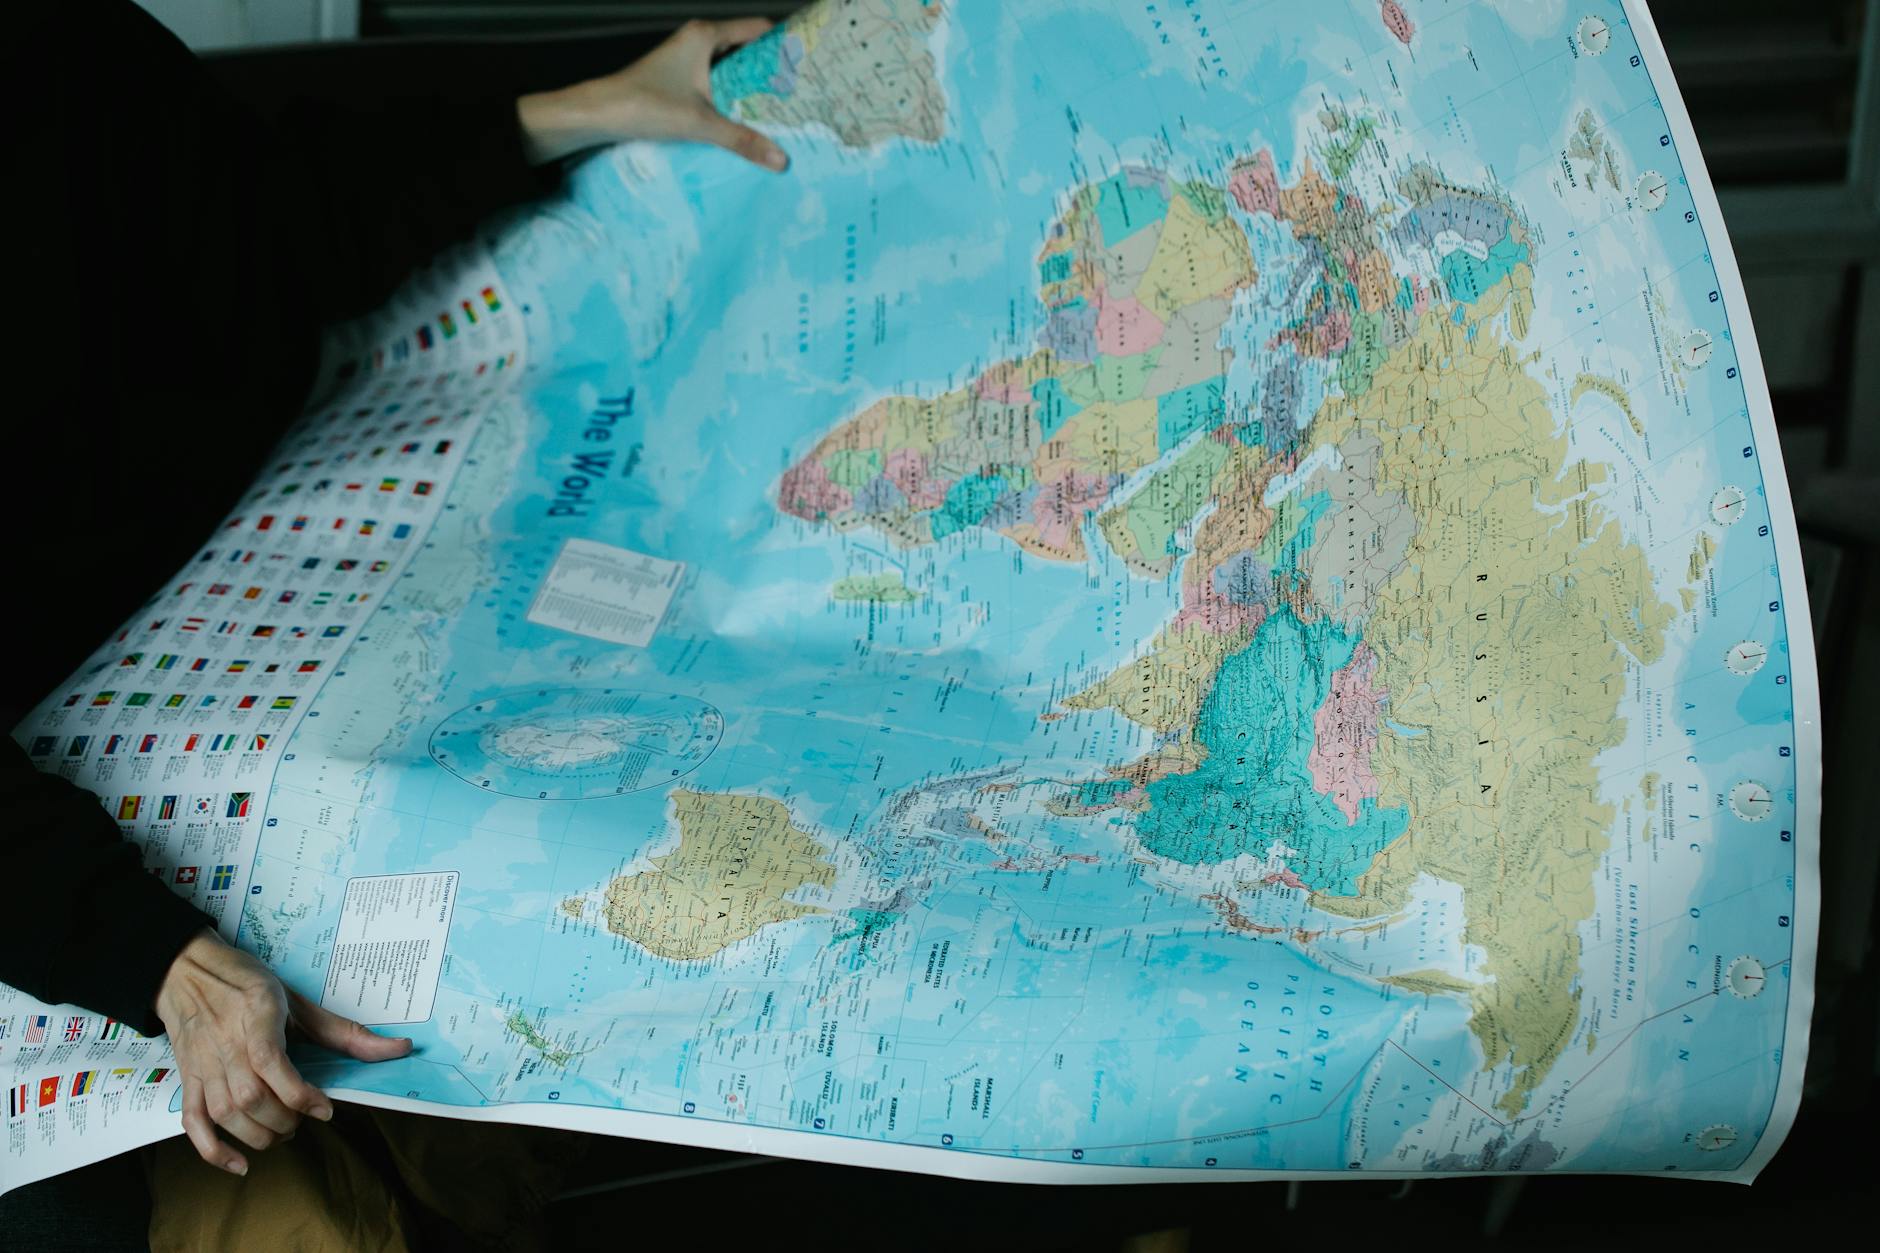
Photo by Lara Jameson on Pexels.com
Functions and Benefits of Maps
The primary power of a map is to display data or information related to the location of an object or phenomenon, along with information about its attributes or descriptions.
Given these characteristics, maps serve several functions, including:
- Displaying information: Maps show the location of objects or phenomena and provide spatial information about aspects such as distance, direction, area, height, and volume.
- Storing and documenting data: Maps are often used to store and document important data, such as land ownership records, forest concession boundaries, and international maritime borders.
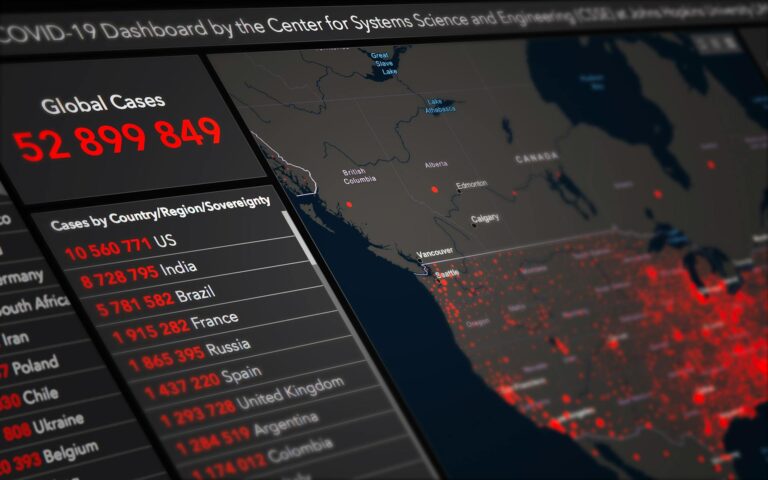
- Communicating spatial information: Maps help spread information in a visual and spatial format, such as train routes or the spread of a virus.
Maps are invaluable tools across various fields in daily life. Some key benefits include:
- They act as navigation tools, whether on land, sea, or air, guiding people from one point to another.
- They help in technical fields like forestry, agriculture, mining, land surveying, and more.
- They serve as tools for distributing information and ideas: for example, maps in newspapers or scientific papers.
- They can perform spatial analysis: showing distribution, patterns, trends, and predictions of phenomena, such as the spread of diseases.
- They are used as bases for planning policies and decision-making: for example, disaster risk maps and regional potential maps.
- They serve as official documents that can be used for legal purposes: like land boundary maps and international boundary maps.
With modern advances, maps have become powerful tools for data analysis and decision-making. Today’s maps are not just static images; they are dynamic tools that are continually updated with real-time data, thanks to satellite imagery, sensor networks, and cloud computing.
What Are Maps Used For?
Maps serve many purposes, across various fields and in everyday life:
- Navigation: Maps guide us through unknown areas, from road trips to backcountry hikes. GPS systems and Google Maps now provide real-time data to enhance navigation.
- Urban Planning: Urban planners use maps to assess population density, land use, and transportation networks. Maps help cities develop efficiently and sustainably.
- Environmental Conservation: Scientists and conservationists rely on maps to monitor ecosystems, track changes in landscapes, and map out protected areas.
- Education: In schools, maps are used to teach students geography and spatial awareness. Historical maps also help in understanding the evolution of civilizations.
- Business and Marketing: Companies use maps to study demographic trends and optimize logistics, ensuring efficient product delivery or service provision.
- Disaster Management: Maps are critical tools in emergency response, guiding rescue teams and planning evacuation routes during natural disasters.
Maps are indispensable tools in countless sectors, helping us navigate, plan, and understand the world better.
How Maps Are Made
A person who creates maps is called a cartographer, and the science of map-making is known as cartography. Cartographers rely on both traditional methods and cutting-edge technologies to produce maps.
Here are the main steps in map-making:
- Defining the purpose: Understanding the goal of the map and the intended audience.
- Data collection: Gathering data from various sources, including satellite imagery, field surveys, and existing maps.
- Processing the data: Organizing and cleaning the data to ensure it’s accurate.
- Designing the map: Selecting the right symbols, colors, and scales to represent the information clearly.
- Disseminating the map: Publishing or distributing the map in print or digital formats.
Technically, these stages are related to:
- Determining the map scale.
- Choosing the map projection.
- Generalizing and classifying data.
- Designing symbols.
- Adding map lettering.
- Designing the map layout.
Modern tools like laser scanning, remote sensing, and GIS systems play a significant role in today’s map-making process.
For instance, laser scanning creates high-resolution 3D models of environments, while remote sensing uses satellite or aerial imagery to gather detailed data about the Earth’s surface.
How to Use a Map
Maps are incredibly versatile.
But to unlock their full potential, you need to know how to use them effectively.
Based on my experience, here’s a guide on how to get the most out of a map:
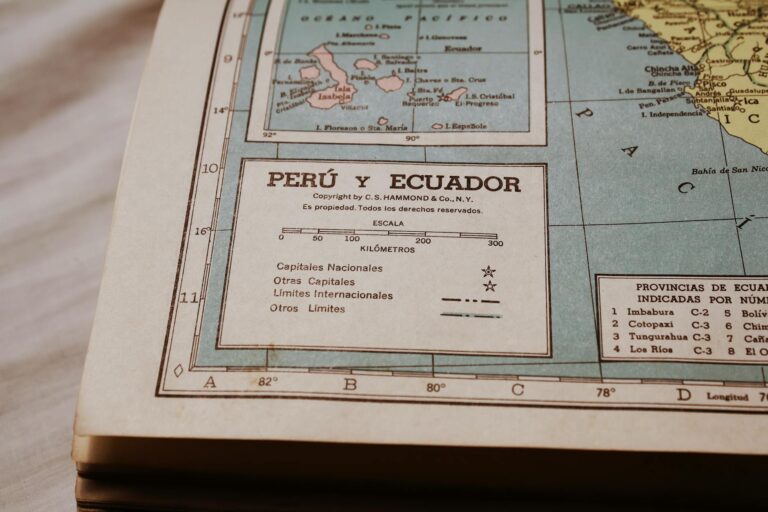
- Understand the legend: The legend explains the symbols and colors used on the map. Familiarize yourself with it, whether you’re reading a physical or thematic map, to interpret data correctly.
- Use the scale: The scale tells you how distances on the map relate to real-world distances. For instance, a 1:50,000 scale means 1 unit on the map equals 50,000 units in reality. Measuring distances accurately helps with navigation.
- Orient with the compass: Most maps include a compass rose or north arrow. Use it to align the map with the terrain, which allows you to understand your direction better. This skill is essential when using both paper and digital maps.
- Identify landmarks: Look for landmarks like rivers, mountains, or buildings that match those on the map. Identifying these features can help you verify your location and make better route choices.
- Plan your route: Whether using the map for hiking or driving, outline your start and destination points. Consider obstacles, terrain features, and estimated travel time. Maps help you anticipate any challenges along the way.
- Use grid references: Some maps use grid references or coordinates to divide the map into numbered sections. Knowing how to use grid references ensures precision in pinpointing specific locations, especially on topographic maps.
Mastering these skills will make you more confident in using maps, whether for simple trips or complex outdoor navigation.
Advantages and Limitations of Maps
Maps have advantages over text, graphs, tables, or images. Their main advantage is their ability to present spatial information about objects or phenomena.
This advantage allows maps to show spatial relationships, such as patterns and trends for mapped objects or phenomena over time.
Additionally, some information is better visualized on a map than in other formats.
To summarize, maps offer several advantages over text, graphs, or tables, particularly in terms of conveying spatial information:
- Overview of large areas: Maps provide a clear and concise way to visualize a large area, such as a country or continent.
- Revealing spatial relationships: Maps help us see patterns and relationships that aren’t immediately obvious, such as the spread of a disease or the growth of cities.
- Easy to understand: Thematic maps can make complex data easier to understand by presenting it visually.
However, maps also come with certain limitations:
- Data accuracy: If the data used to create a map is inaccurate, the entire map becomes unreliable. Maps must be updated regularly to maintain accuracy.
- Information overload: Too much data on a map can make it difficult to interpret. It is important to strike a balance between detail and clarity, ensuring the map is easy to read.
- Distortions: Maps, especially when depicting the globe on a flat surface, can cause distortions in the size and shape of land masses. For example, the Mercator projection tends to make areas near the poles look larger than they are.
Map Data Sources
Map data sources consist of spatial data. Non-spatial data needs to be “spatialized” to be used in maps.
Map data sources include:
- Analog maps: Printed/hardcopy maps from the past, like Indonesia’s RBI maps.
- Tabular data: Non-spatial data stored in tables that can be converted into spatial data.
- Field measurements: Data collected on-site, like vegetation density or soil moisture measurements.
- GPS data: Modern GPS technology has made field surveys easier and map accuracy higher.
- Remote sensing data: Satellite or aerial images provide comprehensive data for all planning and monitoring fields
- Sensor networks: Technologies like sensor networks allow for the real-time collection of environmental data, which is often used to create dynamic maps that can be updated continuously.
History and Development of Maps
Maps have a rich history that spans thousands of years.
Early civilizations like the Babylonians, Egyptians, and Greeks used maps mainly for navigation and trade.
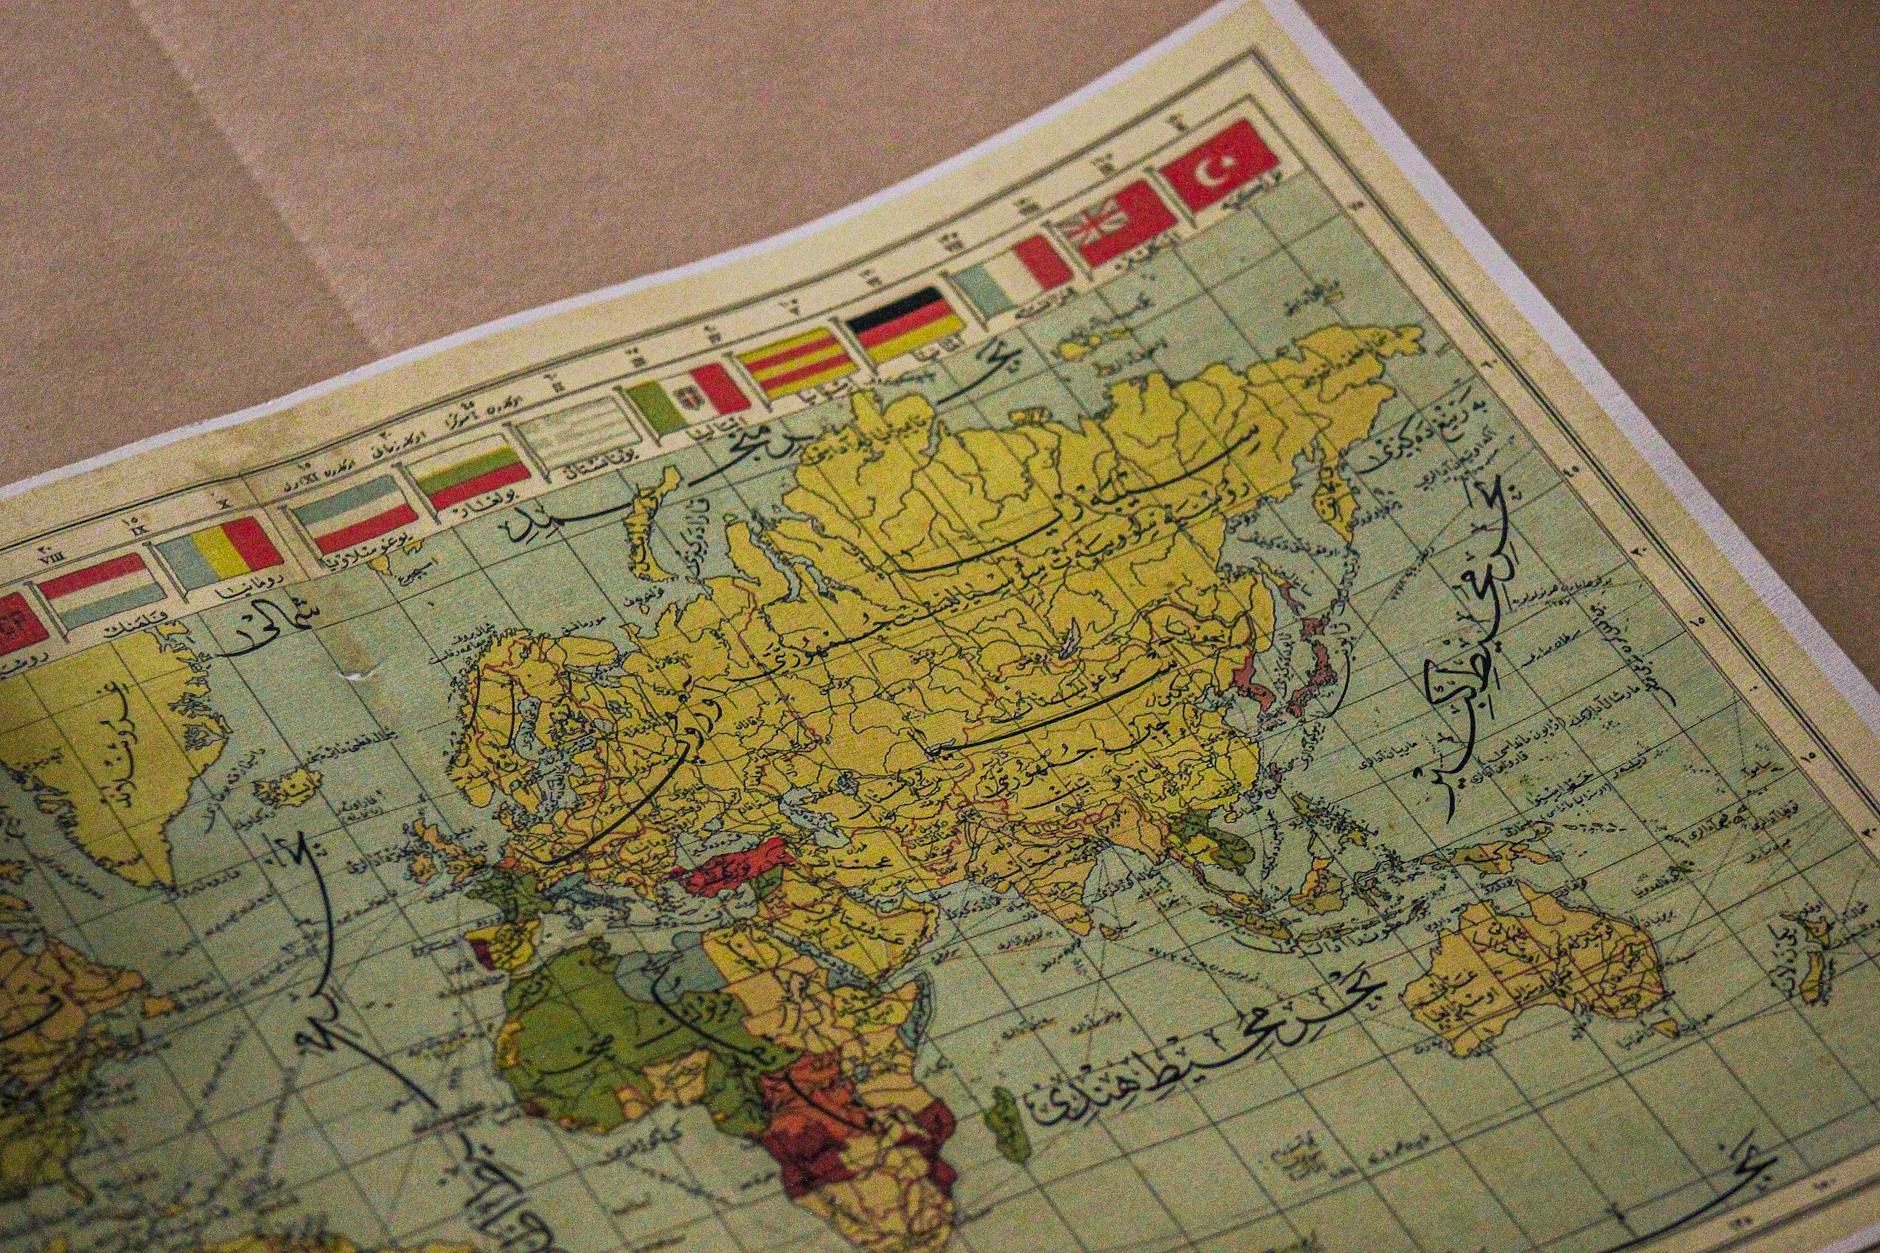
The invention of the printing press in the 15th century allowed for the mass production of maps, making them more accessible to the public. This led to an explosion in map-making, allowing for widespread use in education, government, and navigation.
Today, digital mapping technologies such as Google Maps and Geographic Information Systems (GIS) allow us to create highly accurate maps using satellite imagery and real-time data, enabling us to see and understand the world in ways that were impossible for our ancestors.
Types of Maps
There are many maps made for different purposes, audiences, and media. These maps can be classified based on their purpose, content, scale, media, and the condition of the objects depicted.
Some common map types include:
- General reference maps
- Topographic maps
- Thematic maps
- Navigational charts
- Cadastral maps
Map Elements
Maps are equipped with elements that make them easier to read.
The main map elements include: title and subtitle, map body, scale, direction indicator, legend, inset, and data source.
Other elements include: projection and coordinate system information, map creator, year of creation, and additional information in the form of images or text.
Conclusion
Without even realizing it, you rely on maps every day—whether it’s checking a route on your phone, following disaster coverage, or using weather apps. Maps have evolved from simple hand-drawn illustrations to dynamic digital systems. Augmented reality maps now overlay real-time data onto your world, offering you an enhanced way to navigate and understand your surroundings.
In this article, we’ve covered:
- The definition and purpose of maps.
- Key functions and uses of maps.
- How maps are created and their various types.
- The components and limitations of maps.
- The sources of data used in map-making.
Maps are no longer just static tools; they are living systems that help you interpret complex data and make informed decisions.
Have any thoughts or questions?
Feel free to share in the comments below!