Most GIS analysts can answer “where” with confidence. Point a query at a dataset and the answer comes back clean.
But introduce elevation and suddenly the workflow stalls. The question shifts from “where is it?” to “what does the ground actually look like here?”
And that is a fundamentally different kind of analysis.
That gap is exactly what surface analysis in GIS is built to close.
Contents
What Is Surface Analysis in GIS?
Surface analysis is a set of GIS operations that work with continuous surfaces — spatial datasets where every location has a value and those values change gradually across the area of interest.
The simplest example is elevation.
Every point on the ground has a height, and that height shifts smoothly (with occasional abrupt exceptions like cliff edges) as you move across the terrain.
Surface analysis takes that kind of data and extracts meaning from it:
- How steep is this slope?
- What can an observer at this ridge actually see?
- Where will rainwater go when it hits this hillside?
The Continuous Surface Concept
Think of a continuous surface the way you think of temperature across a city.
There is no location without a temperature value. As you move from the city center to the suburbs, that value shifts gradually rather than jumping. The surface is, in that sense, unbroken.
Elevation data works the same way.
So does rainfall interpolated from gauge stations, soil moisture estimated from satellite data, and air pollution concentration modeled across a region. All of these are continuous surfaces — and all of them are candidates for surface analysis.
Why Rasters Are the Natural Format
Rasters are grids of cells, each holding a single value. Because continuous surfaces vary smoothly across space, a regular grid is a natural way to store and compute them.
When you work with a digital elevation model, you are almost always working with a raster: a grid where each cell holds the elevation of that patch of ground.
Vector formats can store surface data as TINs (triangulated irregular networks) — and for some workflows that is the better choice — but for most surface analysis operations, rasters are the dominant format.
[FIGURE 1] Figure Title: Continuous surface concept — elevation raster Alt Text: A 3D elevation surface rendered as a raster grid. Individual cell values are labeled, showing how elevation varies continuously across the grid, with darker cells representing lower elevations and lighter cells representing higher elevations.
Surface Analysis vs. Terrain Analysis
These two terms appear interchangeably in many GIS textbooks, but there is a practical distinction worth keeping in mind.
Terrain analysis refers specifically to the analysis of elevation surfaces — DEMs, TINs, LiDAR point clouds. It focuses on the physical form of the land.
Surface analysis is the broader category.
It includes terrain analysis, but it also covers any workflow that operates on a continuous surface regardless of what that surface represents.
Interpolating groundwater depth across a basin is surface analysis. Generating a slope raster from a DEM is both surface analysis and terrain analysis.
Understanding the distinction helps you recognize when techniques from one domain apply cleanly to another.
What Are the Main Types of Surface Analysis in GIS?
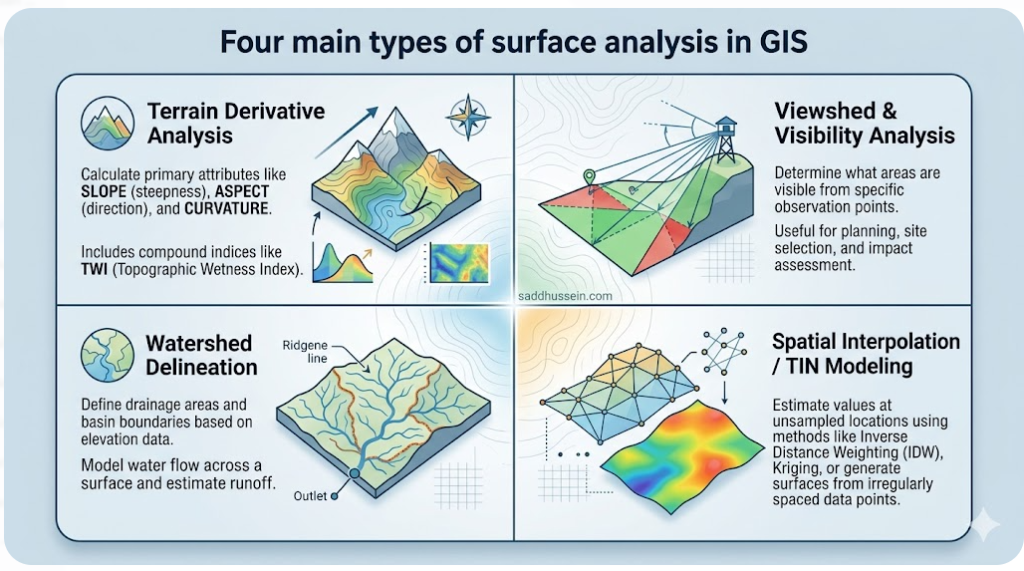
Surface analysis covers a range of operations, but four groups account for the large majority of practical GIS work. Each one answers a different kind of question about the surface.
Terrain Derivative Analysis
Terrain derivative analysis takes an elevation surface and computes secondary variables from it. Slope tells you how steeply the terrain rises or falls at each cell. Aspect tells you which direction that slope faces. Curvature tells you whether the terrain is concave or convex at a given point.
More advanced derivatives include the Topographic Wetness Index (TWI), which combines slope and upslope contributing area to predict where water is likely to accumulate.
From my experience, this is the type of surface analysis most GIS practitioners encounter first — and the one most commonly underused beyond the basics of slope and hillshade.
For a full treatment of terrain derivatives, their formulas, and when to use them, see the dedicated article on terrain derivative analysis in GIS.
Viewshed and Visibility Analysis
Viewshed analysis calculates which areas on a surface are visible from one or more observer points. Place an observer at a fire watch tower. Run a viewshed analysis. The output tells you every cell on the landscape that the observer can see from that position.
The applications extend well beyond fire management:
- telecommunications tower placement,
- landscape impact assessments for wind energy projects,
- military line-of-sight planning, and
- viewshed protection in urban design.
The underlying calculation traces lines of sight from the observer to every surrounding cell, checking whether intervening terrain blocks the view.
For a complete walkthrough of viewshed and visibility analysis methods, see the dedicated article in this cluster.
Watershed Delineation
Watershed delineation uses the elevation surface to model where water flows and where it collects.
The algorithm identifies flow direction at each cell — water moves toward the lowest adjacent neighbor — then accumulates those flow paths to trace stream networks and define catchment boundaries.
This type of surface analysis is central to hydrology, flood risk assessment, erosion modeling, and nonpoint source pollution studies.
The quality of the DEM used for delineation matters enormously: a coarse or noisy DEM produces unreliable drainage networks.
For detailed guidance on watershed delineation workflows, see the dedicated article in this cluster.
Spatial Interpolation and TIN Modeling
Spatial interpolation takes a set of point measurements and estimates values at unmeasured locations to produce a continuous surface.
Methods range from inverse distance weighting (IDW), which weights nearby points more heavily, to kriging, which uses geostatistical relationships in the data.
TIN modeling (triangulated irregular networks) takes a similar set of points and connects them into a network of triangles, producing a surface that passes exactly through each measured point.
Both kriging and TIN-based spatial surface modeling are common in engineering and environmental contexts where the exact geometry of the surface matters.
TINs are common in engineering and terrain visualization workflows where accuracy at specific measurement locations matters.
For a comparison of interpolation methods and practical guidance on when to use each, see the spatial interpolation article in this cluster.
What Data Does Surface Analysis Require?
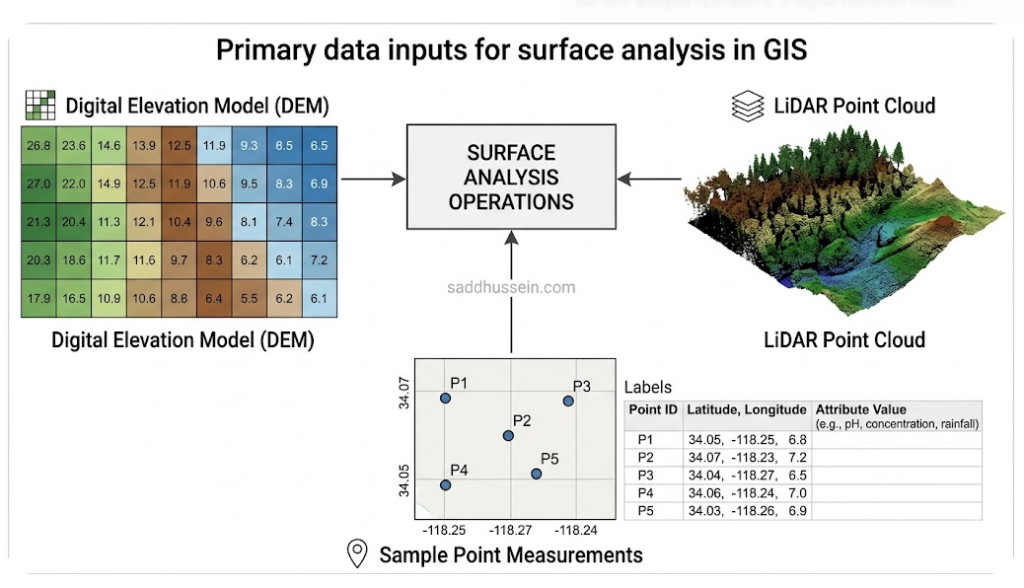
Surface analysis runs on spatial datasets that describe how a variable changes continuously across an area. In practice, that means three main input types.
Digital Elevation Models
DEMs are the primary input for terrain-based surface analysis.
A DEM is a raster where each cell holds an elevation value representing the bare ground surface. Global datasets like SRTM (30m resolution), ALOS World 3D (30m), and Copernicus DEM (30m and 90m) are freely available and usable for regional analyses.
DEM quality determines analytical quality.
A DEM with voids, noise, or systematic biases will produce unreliable derivatives.
As I’ve found working on terrain analysis for conservation projects, spending time on DEM preprocessing — filling sinks, resolving artifacts, checking datum alignment — consistently pays off in cleaner outputs downstream.
LiDAR Point Clouds
LiDAR (Light Detection and Ranging) data captures terrain at high density and accuracy by recording millions of laser returns per square kilometer.
It sits at the intersection of remote sensing and surface analysis — the sensor is airborne, but the output feeds directly into GIS terrain workflows.
Where satellite-derived DEMs give you tens of meters of resolution, airborne LiDAR can reach sub-meter precision.
Point clouds require additional processing before they are usable in surface analysis: ground point classification, filtering, and interpolation into a raster or TIN.
For workflows that demand fine detail, such as urban flood modeling, archaeological site detection, and forest structure analysis, LiDAR is often the appropriate input.
Interpolated Point Datasets
Not all continuous surfaces come from elevation data.
If you want to map soil pH across an agricultural area, you collect soil samples at scattered locations and interpolate between them. If you want to map temperature across a mountain range, you pull from a network of weather stations.
These point datasets are the input to spatial interpolation workflows.
The points carry measured values; the interpolation algorithm estimates values everywhere else; the output is a continuous raster surface ready for further analysis.
What Tools Run Surface Analysis in GIS?
A range of software handles surface analysis, from commercial platforms with complete toolboxes to open-source stacks with equivalent capability. The right choice depends on your budget, workflow environment, and which analysis types you need most.
ArcGIS Spatial Analyst and 3D Analyst
ArcGIS provides two extension toolboxes for surface work. Spatial Analyst covers most raster-based operations:
- slope,
- aspect,
- hillshade,
- viewshed,
- cost surface, and
- interpolation. .
Then 3D Analyst adds TIN modeling, profile tools, and 3D visualization.
Both extensions run inside ArcGIS Pro.
The toolbox integration is tight, documentation is thorough, and the outputs connect cleanly to ArcGIS’s broader geoprocessing environment. For organizations already on the Esri platform, this is the natural starting point.
QGIS with GRASS GIS and SAGA GIS
QGIS itself provides basic surface tools through its native processing algorithms. The real power comes from QGIS’s integration with GRASS GIS and SAGA GIS, which are accessible directly through the Processing Toolbox without leaving the QGIS interface.
GRASS GIS has deep hydrological tools, including its r.watershed module for drainage basin analysis.
SAGA GIS covers terrain derivatives with more options than most analysts will ever need. Together they make QGIS a legitimate alternative to ArcGIS for surface analysis — at no cost.
WhiteboxTools
WhiteboxTools is a standalone geospatial analysis library with particular depth in hydrological terrain analysis.
Its depression filling, flow direction, stream network extraction, and watershed delineation tools are well-regarded in academic and applied hydrology circles.
WhiteboxTools runs from the command line, through Python bindings, or via a desktop interface.
If watershed delineation or DEM preprocessing is central to your work, it is worth learning even if you use ArcGIS or QGIS for everything else.
Python: Rasterio and richdem
For scripted or automated surface analysis workflows, Python offers two libraries that cover most needs.
Rasterio handles raster I/O, reprojection, and masking — it is the standard tool for reading and writing raster data in Python. richdem is specialized for terrain analysis: flow direction, accumulation, slope, and wetness indices.
Based on my experience, Python workflows pay off quickly when you are processing large numbers of tiles, automating multi-step pipelines, or integrating surface analysis into broader data science environments.
The learning curve is real but the flexibility justifies it.
What Can You Do With Surface Analysis Results?
Surface analysis outputs are not usually the final product.
They are analytical inputs to a larger question — and the questions they help answer span a wide range of applied domains.
Flood modeling
Watershed delineation defines the catchment area. Terrain derivatives help characterize the drainage network. Interpolated precipitation surfaces provide the input volume. Together, these layers feed hydrological models that predict flood extent and depth.
Landslide susceptibility mapping
Slope angle is one of the strongest predictors of landslide potential. Combined with curvature, TWI, and land cover, a terrain derivative analysis can produce a susceptibility map that guides infrastructure siting and emergency planning in mountainous terrain.
Solar energy siting
Aspect tells you which slopes receive the most direct sunlight. Slope angle affects panel installation efficiency. Viewshed analysis can identify locations free of shadowing by surrounding terrain. A solar analyst can run all three in sequence to shortlist optimal sites.
Archaeological LiDAR survey.
High-resolution LiDAR over forested terrain reveals surface microtopography invisible to satellite sensors.
Archaeological features — earthworks, terraces, field boundaries — become visible in hillshade and slope analyses that would be impossible with coarser elevation data.
Telecoms tower placement.
Viewshed analysis calculates signal coverage area from candidate tower locations.
Running viewsheds from multiple candidate sites and comparing their coverage overlap is a standard workflow in telecoms planning and rural connectivity projects.
Wrap Up
Surface analysis does not exist in isolation. Every landslide model, every flood extent prediction, every telecommunications coverage plan depends on the ability to interrogate the three-dimensional form of the landscape.
The two-dimensional GIS toolkit is powerful. But the ground is not flat. The moment elevation enters a problem, the analysis needs to match the reality — and that is exactly what surface analysis in GIS provides.
If you have been stopping at the 2D layer, that is the thing worth changing.
FAQ
What is surface analysis in GIS?
Surface analysis in GIS is a set of operations that work with continuous spatial surfaces — datasets where every location has a value that varies smoothly across space. Most commonly this means elevation data, but it also includes interpolated rainfall, soil moisture, and other variables. The goal is to extract meaningful information: slope gradients, visible areas, drainage patterns, or estimated values at unmeasured locations.
What is the difference between surface analysis and terrain analysis?
Terrain analysis is a subset of surface analysis that deals specifically with elevation surfaces — DEMs, LiDAR-derived terrain models, and TINs. Surface analysis is the broader category that includes any continuous spatial surface, not just elevation. If you are working with a slope raster from a DEM, that is terrain analysis. If you are interpolating groundwater depth from well measurements, that is surface analysis but not terrain analysis.
What data do you need for surface analysis in GIS?
The primary input for most surface analysis workflows is a digital elevation model (DEM). LiDAR point clouds provide high-resolution terrain data where accuracy demands are greater. For interpolation-based workflows, you need georeferenced point measurements of the variable you want to model — soil samples, weather station readings, groundwater measurements. DEM quality is the single most important factor in how reliable your results will be.
What tools are used for surface analysis in GIS?
The main options are ArcGIS Spatial Analyst and 3D Analyst (commercial), QGIS combined with GRASS GIS and SAGA GIS (free and open source), WhiteboxTools for hydrological analysis, and Python libraries including Rasterio and richdem for scripted pipelines. For most practitioners, the choice comes down to whether you are in an Esri environment or an open-source environment — both stacks are capable of covering the full range of geospatial analysis techniques that surface work demands.
What are the main applications of surface analysis in GIS?
Surface analysis feeds into flood modeling, landslide susceptibility mapping, solar energy site selection, archaeological survey, watershed management, and telecoms coverage planning, among others. Any GIS problem that involves terrain shape, water movement, or visibility is likely drawing on surface analysis at some stage of the workflow.
Ready to Go Deeper?
Now that you have the overview, the best next step is to pick the type of surface analysis most relevant to your current work and go from there.
If terrain derivatives — slope, aspect, curvature — are what you need, head to the terrain derivative analysis article.
If watershed delineation is the priority, the hydrological analysis article walks through the full workflow.
If you need to estimate values at unmeasured locations from point data, the spatial interpolation article covers the main methods.
Each article in this series stands on its own, so you can start wherever your actual problem sits.
Happy mapping!