Did you know that the scale of a map can dramatically influence how effectively a map user interprets and navigates the map?
Every map has a scale. The scale allows you to know exactly the distance or area of the earth’s surface being mapped.
A map scale is the ratio between the distance between two arbitrary points on a map and the horizontal distance between those points on the Earth’s surface, measured using the same unit of length.
Understanding the map scale is crucial for both mapmakers and map readers. Geographic representation of spatial relationships depends heavily on understanding the scale accurately.
This article will explain map scales, including their definition, function, types, and how to calculate map scales.
Let’s begin!
Contents
- 1 What is a Map Scale?
- 2 The Importance of Map Scale
- 3 Types of Map Scales and How to Read Them
- 4 How to Calculate the Map Scale with the Calculation Formula
- 4.1 How to Calculate Map Scale if the Actual Distance is Known
- 4.2 How to Calculate Map Scale with a Graphical Scale
- 4.3 How to Calculate Map Scale Using Another Map with a Known Scale
- 4.4 How to Calculate Map Scale Using Contour Lines
- 4.5 How to Calculate Map Scale Using Latitude and Longitude
- 4.6 How to Calculate the Actual Distance Based on Other Map
- 5 Enlarging and Reducing Map Scale
- 6 How to Enlarge and Reduce Map Scale
- 7 Large Scale vs Small Scale
- 8 How Map Scale Affects Other Map Components
- 9 Conclusion
What is a Map Scale?
In brief, a map scale is the ratio between the distance between two points on a map and the actual distance on the Earth’s surface.
A map scale can also be defined as the ratio between the radius of the globe and the radius of the Earth (spheroid).
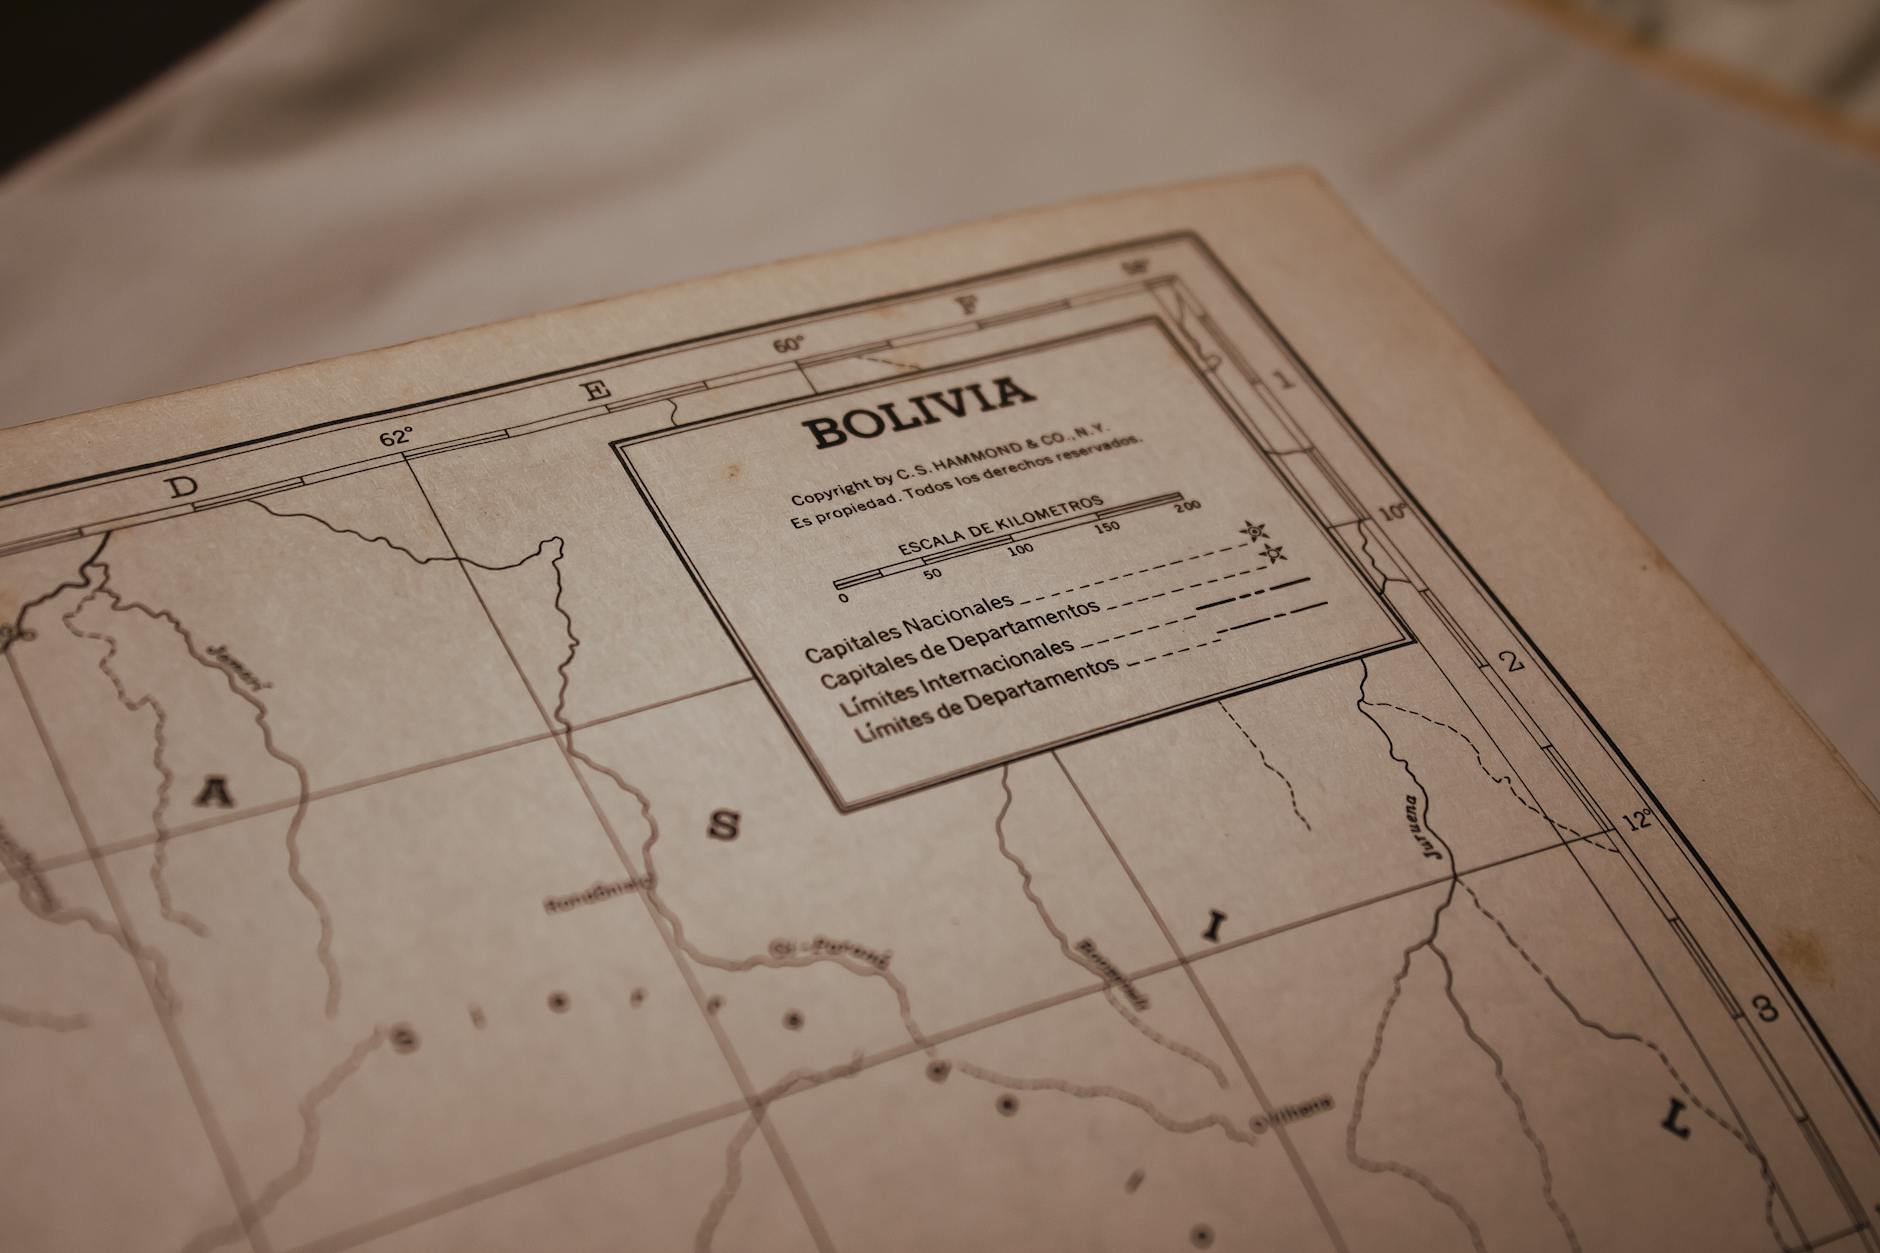
Every map includes a scale, for example, 1:50,000. This means that every 1 cm on the map corresponds to 50,000 cm in reality.
In simple terms, the scale on a map can be understood using the formula:
Scale = (Distance on the map)/(Distance on the Earth’s surface)
The ratio on the scale must use the same unit of measurement, such as cm, inches, yards, etc. It is important to note that the distance on a map refers to the horizontal distance on a flat surface. Thus, you must consider the map projection used and the terrain relief in the field when measuring distances based on the scale.
The Importance of Map Scale
The map scale plays a very important role.
In my professional opinion, the scale directly influences the map usage and its accuracy. The function of the map scale is to help you calculate or estimate the size (distance, area) on the ground based on its appearance on the map.
Therefore, the scale is crucial in map-making and must be accurate.
The scale serves as a reference when creating a map to ensure that the map provides an accurate representation of the objects depicted.
Types of Map Scales and How to Read Them
There are at least three (3) types of ways to represent a map scale:
- Numerical scale
- Graphical scale
- Verbal scale
Numerical Scale
The numerical scale is the most commonly used type of scale. In this method, the scale expresses the ratio between the distance on the map and the distance on the ground. For example, topographic maps have scales of 1:5,000, 1:10,000, 1:25,000, 1:50,000, and 1:250,000.
Graphical Scale
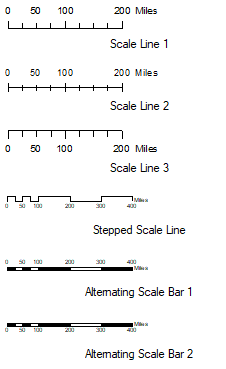
A graphical scale (graphical scale line) shows the scale as a straight line divided into equal units or segments, with each segment representing a proportional length on the ground. This type of scale is ideal for maps that are printed or displayed in various paper sizes or screen dimensions.
The advantage is that the graphical scale adjusts to changes in the map size during printing or zooming in the map dimensions, ensuring the scale remains accurate. The graphical scale can be displayed in various styles, from simple to more complex designs. Below are examples of several graphical scale styles available in ArcGIS software.
Verbal Scale
The verbal scale is a map scale expressed in direct sentences. An example of a verbal scale is: one inch to one mile. This means that 1 inch on the map represents 1 mile on the ground.
At first glance, this might seem cumbersome as it requires a bit of extra thinking. However, sometimes a verbal scale is quicker to understand if you’re familiar with the units used. For instance, a 1:100,000 scale is easier to grasp if expressed as: 1 cm on the map equals 1 km on the ground.
This type of scale was widely used in older maps and is rarely used today.
How to Calculate the Map Scale with the Calculation Formula
To calculate the map scale, you must understand the general formula for calculating the scale, which is:
Scale = (Distance on the map)/(Distance on the Earth’s surface)
Using this basic formula, you can calculate the map scale that is not yet known by several methods as follows.
How to Calculate Map Scale if the Actual Distance is Known
In the first case, you have two known pieces of information: the distance on the map and the actual distance on the Earth’s surface. To calculate the map scale, use the basic map scale formula.
For example, the distance between City A and City B on the map is 8 cm. The actual distance between City A and City B is 160 km. So, what is the map scale?
The formula for calculating the map scale is: Scale = (Distance on the map)/(Actual distance)
So, Scale = (8 cm)/(160,000,000 cm)
Thus, the map scale is 1:2,000,000.
How to Calculate Map Scale with a Graphical Scale
Next, let’s practice calculating the map scale using a graphical scale, or more precisely, converting a graphical scale into a numerical scale. In this case, you have a map with a graphical scale, and you will determine the numerical scale of that map.
To calculate the map scale using the graphical scale, follow these steps:
- Measure the length of one segment on the graphical scale. For example, let’s say one segment is 1 cm long on the map.
- Determine the real-world distance that this segment represents. This information is usually provided alongside the graphical scale. For example, if the segment represents 1 kilometer in the real world, this is your reference distance.
- Convert the real-world distance into the same units as the segment length on the map. In this case, if 1 cm on the map equals 1 kilometer in the real world, convert kilometers into centimeters (1 kilometer = 100,000 centimeters).
- Calculate the numerical scale by dividing the real-world distance (in the same unit) by the segment length on the map. Using the example above:
- Real-world distance: 1 kilometer = 100,000 centimeters.
- Segment length on the map: 1 cm.
- So, the numerical scale would be 1:100,000.
This means that every 1 cm on the map represents 100,000 cm (or 1 km) in the real world. Check for accuracy and make adjustments if necessary.
Ensure that the calculated numerical scale is consistent with the other scales on the map, or use this method to confirm the accuracy of a map’s existing scale.
By following these steps, you can easily convert a graphical scale into a numerical scale, allowing for precise distance calculations on maps.
How to Calculate Map Scale Using Another Map with a Known Scale
In the second case, you have two maps. The first map has a scale of 1:10,000, while the second map’s scale is unknown. You’re asked to calculate the scale of the second map.
The steps to calculate it are as follows:
- Determine the distance between two points, say points A and B, on the first map, and measure the distance. Suppose the distance is 10 cm.
- Measure the distance between point A and point B on the second map. Suppose the measurement result is 5 cm.
- To calculate the scale on the second map using the first map, use this formula: (Distance on map 1)/(Distance on map 2) = (Denominator of map scale 1)/(Denominator of map scale 2)
The denominator of the scale is the number behind the colon on the scale. In this case, the denominator of the first map scale is 10,000.
Using this formula, the scale of the second map is: (Distance on map 1)/(Distance on map 2) = (Denominator of map scale 1)/(Denominator of map scale 2)
10/5 = 10,000/X
X = 5/10 x 10,000
X = 5,000
Based on the calculation, the scale of the second map is 1:5,000.
How to Calculate Map Scale Using Contour Lines
You can calculate the map scale using contour lines on the map. Contour lines are lines on a map that connect points with the same elevation from sea level. The guideline is to use the following formula: CI (Contour Interval) = 1/2000 x denominator of the scale
CI (Contour Interval) is the difference in elevation between two contour lines, expressed in meters. To calculate the map scale using contour lines, follow these steps:
- Look at the contour interval on the map. For example, the contour interval is 12.5 m.
- Calculate the scale using the formula: CI = 1/2000 x denominator of the scale
12.5 = 1/2000 x denominator of the scale
Denominator of the scale = 2000 x 12.5
Denominator of the scale = 25,000
Therefore, based on the calculation, the map scale is 1:25,000.
How to Calculate Map Scale Using Latitude and Longitude
You can also calculate the map scale based on latitude and longitude. Here’s how:
- Determine the location of the mapped area, find out the latitude range, and then estimate the distance between two longitude/latitude lines in that area. For example, the map area is at the equator, where 1 degree of latitude is approximately 111.332 km.
- Measure the distance between two latitude lines on the map and note the difference. For example, the distance on the map between the 0° to 0° 30 minutes line is 1 cm.
- Calculate the actual distance based on the latitude difference. The latitude difference is 30 minutes, while 1 degree = 60 minutes.
So, the distance between the lines is: 30/60 x 111,332 km = 55,666 km
Calculate the map scale using the basic formula: map scale = distance on the map / actual distance.
So the map scale is 1 cm represents 55.666 km, or if expressed as a numerical scale, the map scale is 1:5,566,600.
This method is rarely used due to its complexity.
You must know the exact distance between latitude or longitude based on the location of the mapped area.
In addition, this calculation is also influenced by the projection used, and the distance between latitude or longitude lines is usually an approximate figure.
Moreover, map scale calculations can be done with the four other methods mentioned above.
How to Calculate the Actual Distance Based on Other Map
To calculate the actual distance based on the distance on the map, modify the basic map scale formula to:
Actual distance = Distance on the map x denominator of the scale
For example, on a map with a scale of 1:50,000, the distance from point X to point Z is 4 cm. Therefore, the actual distance on the ground between point X and point Z is:
= 4 cm x 50,000
= 200,000 cm
= 2 km.
Enlarging and Reducing Map Scale
Before enlarging or reducing the scale, understand some basic principles.
Principles in Reducing Map Scale
The first principle is that reducing the map scale is followed by a generalization process on the mapped objects.
This generalization process can involve graphical generalization, where the “image” of the object changes, such as through simplification or removal. It can also involve generalization of thematic information. For example, a land cover map that originally had 12 classes may only have 7 classes after reducing the scale.
This generalization process largely depends on the degree of change or scale reduction being carried out.
Principles in Enlarging Map Scale
The second principle is that enlarging the map scale is followed by adding information to the enlarged map. This is the opposite of the map generalization process.
So, as the map scale increases, objects should become more detailed.
This detail can involve graphical details. For example, due to scale enlargement, the meanders of a river or coastline that were previously unseen become visible.
This detail can also involve thematic information. For example, due to scale enlargement, the road classes that previously only showed arterial roads can now display more detailed classes, such as local roads and footpaths.
In principle, every change in either enlarging or reducing the map scale causes certain consequences and requires special attention from the map maker.
Thus, changing the map scale must be done carefully.
Changing the map scale without adding or removing significant information can only be done if the scale change is not too large, allowing the map features to be maintained as in the source map.
How to Enlarge and Reduce Map Scale
Considering these principles, here are some methods for enlarging or reducing the map scale:
- Grid Method
- Union Jack Method
- Using a Pantograph
- Using a Map-o-graph
- Using GIS Software
Grid Square Method
The method of enlarging and reducing the map scale using a grid is done through the following steps:
- Create a grid with square shapes on the source map or the map that will be enlarged/reduced. For example, with a size of 4 x 4 cm.
- Create a square grid on a blank sheet of paper with the enlargement/reduction size multiplied by the grid size on the original map. For example, if you want to reduce by half, then draw a grid with a size of 2 x 2 cm. The number of grids on the map and the blank sheet must be exactly the same.
- After the square grid is created on the blank sheet, the map can be redrawn on the blank sheet. These grids will greatly assist the process of drawing the second map.

Union Jack Method
The method of enlarging and reducing the map scale using the Union Jack method is the same as using the grid square method.
The difference lies in the shape of the grid used to assist in drawing the map. In the grid method, the drawing is done using square grids, while in the Union Jack method, this grid is added with two horizontal lines.
Illustration of Enlarging or Reducing Map Scale Using the Union Jack Method
Using a Pantograph
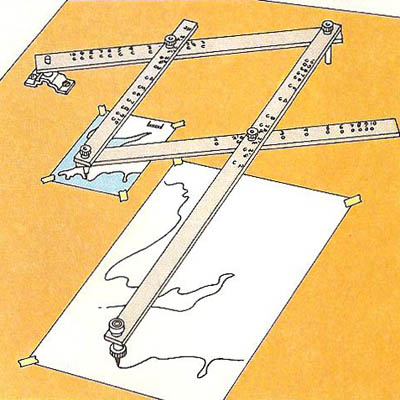
A pantograph is a tool used to enlarge and reduce the scale. The pantograph has parts such as arms, an observation lens, and a pencil holder.
To enlarge or reduce the map scale using a pantograph, follow these steps:
- Calculate the pantograph arm setting using the formula: Scale factor = m/M x 500
Where:- m = map scale to be changed
- M = desired map scale
- 500 is the tool constant.
- For example, if the map will be enlarged 5 times, then the scale factor = 1/5 x 500 = 100.
- Prepare the pantograph, map, and paper.
- Adjust the pantograph scale as needed. Based on the calculation, the pantograph arm is set to a scale factor of 100.
- Place the pantograph on the map to be changed, right at the pencil tip.
- Move the needle according to the shape of the map, and the paper will automatically draw the map according to the enlargement/reduction.
Using a Map-o-graph
To reduce and enlarge the map scale, you can also use a tool called a Map-o-graph. This tool is equipped with a lens that can be moved up or down. In fact, this tool is a type of optical pantograph, where an optical device is included.
This method has largely been abandoned due to the limited availability of the tool.
Using GIS Software
Using GIS software is the most common method of reducing and enlarging maps in the current era due to the availability of GIS software, digital data, and human and technological resources.
The process is very easy. To do it, you only need to change the scale number when doing the map layout process.
Large Scale vs Small Scale
One of the most common points of confusion in cartography is the relationship between map scale and the amount of detail shown.
Counterintuitively, a large-scale map doesn’t mean it covers a large area — it means the opposite.
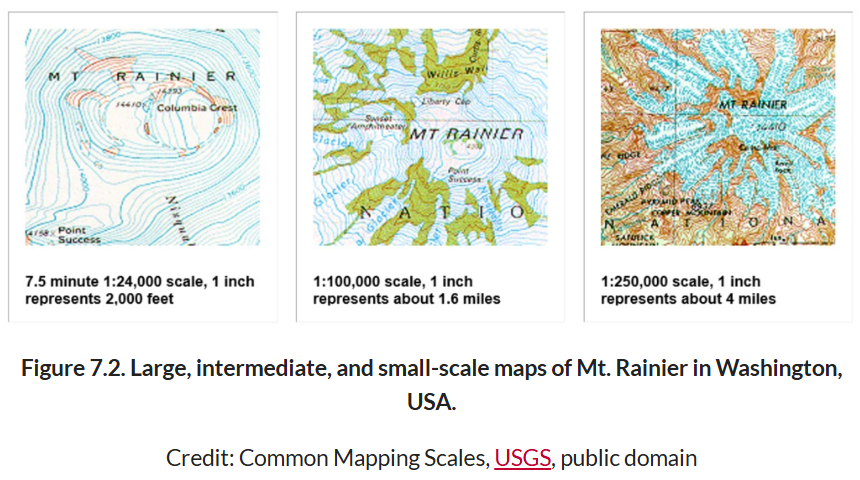
A large-scale map uses a ratio like 1:5,000 or 1:10,000, meaning a small area is stretched across the map to show fine detail. Think of city street maps or cadastral maps used for land parcel surveys, which can go as precise as 1:100. The closer the ratio is to 1:1, the larger the scale — and the more detail you see.
A small-scale map, on the other hand, uses a ratio like 1:500,000 or 1:1,000,000 to fit a vast area onto a single page. You gain geographic breadth but sacrifice detail.
Between these two extremes sit medium-scale maps, typically ranging from 1:250,000 to 1:500,000, which are commonly used for regional or provincial mapping where a balance between coverage and detail is needed.
The simplest way to remember the difference: the larger the bottom number in the ratio, the smaller the scale — and the less detail the map can show.
How Map Scale Affects Other Map Components
Understanding map scale is not just about knowing how distances translate from map to reality; it’s also crucial for grasping how other key components of a map are influenced.
Here’s a breakdown of how map scale impacts area coverage, the detail of information (map generalization), the representation of symbols, map projection, and the type of map media used.
1. Area Coverage
The scale of a map directly affects the area that it covers.
- Large-Scale Maps: These maps, which have smaller denominators (e.g., 1:10,000), cover smaller areas but show them in greater detail. For example, a neighborhood map might be large-scale, allowing you to see individual buildings, streets, and parks.
- Small-Scale Maps: Conversely, small-scale maps (e.g., 1:1,000,000) cover larger areas, such as entire countries or continents, but with less detail. These maps provide a broader overview, showing large geographic regions without focusing on finer details.
Understanding the relationship between scale and area coverage is essential when choosing a map for a specific purpose, whether you’re navigating a city or studying global geography.
2. The Detail of Information (Map Generalization)
Map scale also determines the level of detail that can be depicted, a process known as map generalization.
- Large-Scale Maps: These maps allow for a high level of detail. As the scale increases, the map can show more specific features like minor roads, small streams, and individual buildings.
- Small-Scale Maps: These maps necessitate generalization, where details are simplified or omitted to make the map readable. For instance, smaller roads might be omitted, rivers could be shown as simple lines, and forests as broad green areas without specific trees or terrain features.
Map generalization is crucial for maintaining the map’s usability and readability as the area depicted increases, ensuring that the map remains functional despite the loss of some detailed information.
3. How Symbols Are Depicted or Represented
The representation of symbols on a map is closely tied to the scale.
- Large-Scale Maps: On these maps, symbols can be more detailed and specific. For example, different types of roads might be represented with varying line styles or widths, and landmarks might be depicted with icons that closely resemble the actual features.
- Small-Scale Maps: On small-scale maps, symbols are often more abstract or generalized to prevent overcrowding. A single symbol might represent a type of feature, such as a dot for a city, without distinguishing between different sizes or characteristics of those features.
The choice of symbols and their representation must balance detail with clarity, especially as the scale of the map decreases.
4. Map Projection
Map scale also interacts with the map projection—the method by which the curved surface of the Earth is represented on a flat map.
- Large-Scale Maps: These maps typically use projections that minimize distortion over small areas, such as the Universal Transverse Mercator (UTM) projection, which is ideal for detailed local maps. Here, scale distortions are minimal, ensuring accuracy in both distance and area.
- Small-Scale Maps: As the scale decreases and the area covered increases, the choice of projection becomes more critical. Projections for small-scale maps, like the Robinson or Mercator projections, must account for the trade-offs between shape, area, and distance distortions across the entire map. These distortions become more pronounced as the map covers larger portions of the Earth’s surface.
Choosing the appropriate projection based on scale is essential for accurately representing geographic relationships on a map, especially when depicting large areas where distortion can significantly affect the interpretation of spatial relationships.
5. Map Media
The type of media used to present a map also plays a significant role in how map scale is applied and perceived.
- Paper Maps or Printed Maps: On these traditional maps, the scale is fixed. Once the map is printed, the scale cannot be changed. This means that the user must rely on the provided scale for any distance measurements or interpretations, and there is no ability to zoom in or out.
- Digital and Online Maps: In contrast, digital and online maps offer multiple scales that can change dynamically as the user zooms in or out. This flexibility allows users to explore different levels of detail within the same map. However, it also means that the scale must be continually adjusted or interpreted based on the zoom level, making understanding the scale even more crucial for accurate navigation and analysis.
Choosing between these types of map media depends on the context in which the map will be used.
For example, printed maps are often used for outdoor activities where no digital devices are available, while digital maps are favored for their versatility in planning and real-time navigation.
Conclusion
When discussing maps, it is impossible to avoid talking about map scales. With a scale, the reader or user of the map can know precisely how the actual Earth’s surface compares to what is shown on the map.
In this article, you have learned about map scales, including:
- The definition of a map scale
- The function of the map scale
- The types of map scales
- How to calculate the map scale
- How to enlarge and reduce the map scale
- How map scale affects other map components, including area coverage, detail of information, symbol representation, map projection, and the type of map media used.
If you have any questions or would like to discuss further, please don’t hesitate to write them in the comments section below.
I hope this article is helpful.
Happy mapping!